From identifying resistance levels to leveraging advanced studies like IV percentile, this method can significantly enhance your trading decisions. However, it’s important to remember that technical analysis should complement, not replace, other trading strategies. Here, we explore key concepts and tools, explaining how to use them effectively for trading options.
The Role of Technical Analysis in Trading
Technical analysis is often compared to astrology for entrepreneurs—intriguing but not foolproof. While patterns and trends are useful in understanding market behavior, external factors such as geopolitical events or earnings reports can render them irrelevant. For instance, a stellar earnings report can invalidate previously established patterns. Thus, technical analysis should only be one component of a comprehensive trading strategy.
Essential Time Frames for Analysis
Understanding and utilizing the right time frames is crucial in technical analysis. Each time frame serves a specific purpose:
- One-Year One-Day Chart: This chart is widely used by traders to establish support and resistance levels. Observing price pivots over a longer period helps identify critical thresholds.
- Two-Day Five-Minute Chart: This shorter interval compares the previous trading day’s sentiment to the current day, providing insights into shifts in market behavior.
- 20-Day One-Hour Chart: Typically used around earnings reports, this chart helps determine whether a stock has been trending bullish or bearish in the preceding month.
- Three-Year One-Week Chart and Max Bi-Monthly Chart: These charts are valuable for long-term comparisons, such as analyzing past earnings reports or making historical comparisons to events like the 2008 financial crisis.
Identifying Support and Resistance Levels
Support and resistance levels are foundational elements of technical analysis. Support levels represent price points where a stock tends to stop falling, while resistance levels indicate where it may cease to rise. Drawing these levels involves examining significant price movements on the chart. For example:
- A stock trading near $397.78 with a resistance level at $405 suggests a potential rejection point if volume doesn’t drive it higher. However, strong volume could lead to a breakthrough, necessitating adjustments to the resistance level.
Leveraging Trendlines for Predictive Insights
Trendlines add depth to your analysis by highlighting price patterns over time. By studying the behavior of an asset during specific periods, such as weeks three and four of a month, traders can estimate potential moves. For instance, using trendlines, you might predict that an asset could drop to $398.50 in a given scenario. While predictions might not always be accurate, they provide a structured framework for decision-making.
Incorporating standard deviation bands, such as yellow dotted lines, can offer additional guidance, indicating areas of potential price movement with a margin of error. Using such tools, traders have achieved substantial returns, such as a 150% gain using put debit spreads.
Utilizing RSI for Momentum Analysis
The Relative Strength Index (RSI) is an effective tool for gauging a stock’s momentum. RSI values below 50 suggest bearish trends, while values above 50 indicate bullish sentiment. For instance, an RSI of 42 for SPY signals bearish activity. RSI also helps identify overbought or oversold conditions, which may precede reversals. However, these indicators are not guarantees. For example:
- In August, SPY’s RSI peaked at 73, marking an overbought condition, yet the stock continued to rise before reversing.
- Similarly, oversold conditions in January saw SPY dropping further before stabilizing.
RSI is most effective when used to confirm trends rather than predict immediate reversals.
Understanding the MACD Indicator
The Moving Average Convergence Divergence (MACD) is another valuable tool for assessing momentum. This indicator tracks the relationship between two moving averages of a stock’s price, helping traders determine whether a stock is in a bullish or bearish phase. For instance:
- If the MACD line crosses below the signal line, it indicates bearish momentum.
- Conversely, if the MACD line crosses above the signal line, it signals bullish activity.
By combining RSI with MACD, traders can form a comprehensive view of a stock’s current and potential performance.
Trading options can be highly lucrative, but success requires a thorough understanding of market trends and patterns. Technical analysis is an essential tool that helps traders make informed decisions by analyzing historical price data and market activity. This article explores how to effectively use technical analysis for options trading, covering six critical areas that will enhance your trading strategies.
- Understanding the Basics of Technical Analysis
Before diving into the specifics of options trading, it’s crucial to understand what technical analysis entails. Unlike fundamental analysis, which examines a company’s financial health and macroeconomic factors, technical analysis focuses solely on price movements and trading volume.
The primary tools of technical analysis include:
- Price Charts: Visual representations of an asset’s historical price action.
- Indicators: Tools such as Moving Averages, RSI (Relative Strength Index), and MACD (Moving Average Convergence Divergence) that provide insights into market trends.
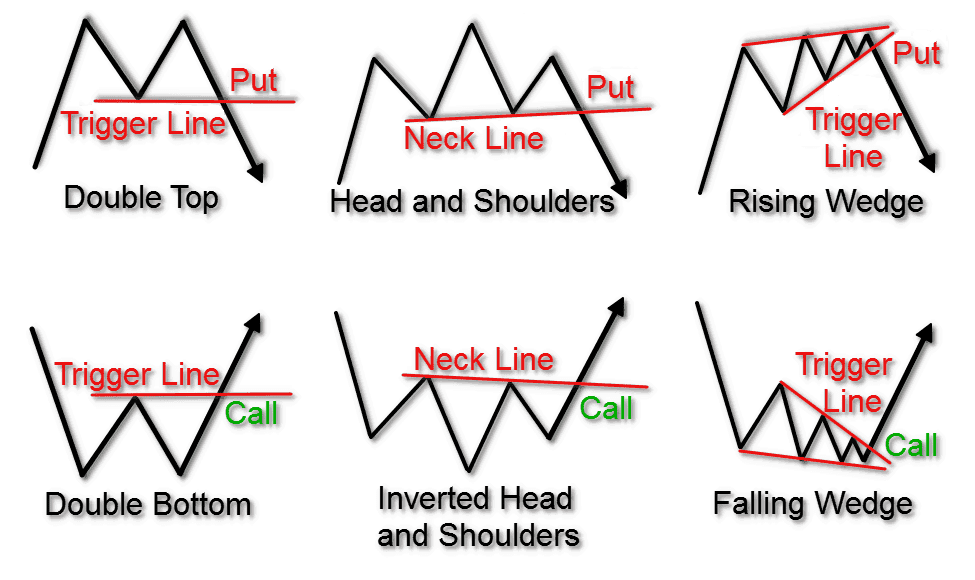
- Patterns: Recognizable formations on charts, like head and shoulders or double tops, that predict future price movements.
Technical analysis assumes that all relevant information is already reflected in the asset’s price, making it ideal for short-term trading like options.
- Identifying Key Support and Resistance Levels
These levels represent price points where the asset has historically struggled to move below (support) or above (resistance).
Here’s how to use them in options trading:
- Support Levels: When the price nears a support level, traders often anticipate a reversal or bounce. For bullish strategies like buying calls or selling puts, entering near support can be advantageous.
- Resistance Levels: Conversely, resistance levels indicate potential price ceilings. Bearish strategies like buying puts or selling calls are often executed near these points.
To identify these levels, use line charts, pivot points, or Fibonacci retracement tools. These tools help traders pinpoint critical price zones that guide entry and exit decisions.
- Utilizing Trend Analysis for Directional Trades
Options traders frequently rely on trends to predict future price movements. Identifying whether an asset is in an uptrend, downtrend, or sideways market is crucial for determining the appropriate trading strategy.
- Uptrend: Characterized by higher highs and higher lows. Bullish options strategies, like buying calls or bull call spreads, are suitable in such markets.
- Downtrend: Defined by lower highs and lower lows. Bearish strategies, such as buying puts or bear put spreads, are effective here.
- Sideways Market: When prices fluctuate within a range, neutral strategies like iron condors or straddles can be profitable.
Indicators such as the 200-day moving average can help identify trends. For example, if the price is consistently above the 200-day MA, the market is likely in an uptrend.
- Applying Indicators to Enhance Decision-Making
Technical indicators simplify the process of analyzing price data and can confirm or refute potential trade setups. Here are some of the most commonly used indicators in options trading:
- Use short-term MAs (e.g., 20-day) for quick trades and long-term MAs (e.g., 200-day) for trend confirmation.
- . An RSI above 70 indicates overbought conditions (ideal for selling calls), while below 30 suggests oversold conditions (ideal for buying calls).
- Bollinger Bands: Measure market volatility and provide upper and lower bands around the price. When prices touch the upper band, they’re considered overbought; the lower band suggests oversold conditions.
Combine multiple indicators to confirm your trade setups. For instance, if both the RSI and Bollinger Bands indicate oversold conditions, it’s a strong signal for a bullish trade.
- Recognizing Chart Patterns for Predicting Movements
. Options traders can use these patterns to anticipate breakouts, reversals, or continuation of trends.
- A head and shoulders top signals a bearish reversal, while an inverse pattern indicates a bullish reversal.
- Triangles: Symmetrical, ascending, or descending triangles suggest a potential breakout. Traders can position for significant price moves by placing options trades ahead of the breakout.
Recognizing these patterns in real-time can give you an edge in executing timely options trades.
- Risk Management: The Key to Long-Term Success
Options trading carries inherent risks due to leverage and time decay, making it vital to protect your capital.
- Position Sizing: Limit the size of each trade to a small percentage of your portfolio, typically 1-2%. This ensures no single loss can significantly impact your overall performance.
- Stop-Loss Orders: Define a maximum loss for each trade and use stop-loss orders to exit positions when the market moves against you.
- Diversification: Avoid concentrating your capital in one trade or market sector. Spread your investments across various options strategies and assets.
By incorporating risk management practices, you’ll improve your chances of sustaining profitability over the long term.
Final Thoughts on Using Technical Analysis for Options Trading
Mastering technical analysis is a powerful way to improve your options trading performance. By understanding support and resistance levels, leveraging trend analysis, utilizing technical indicators, and recognizing chart patterns, you can make more informed trading decisions. Coupled with disciplined risk management, these tools provide a robust framework for success in the volatile world of options trading.
Remember, consistent practice and analysis are key. As you gain experience, you’ll develop a more intuitive understanding of market dynamics, enabling you to refine your strategies and achieve your financial goals.